
Rendering MOLA Data into an Image Map and Surface Plot
|
|
Rendering MOLA Data into an Image Map and Surface Plot |
|
|
|
The original Live From Mars Activity 1.2 - Mapping the Topography of Unknown Surfaces offers a wonderful modeling activity for students on the mathematics and science behind the MOLA. As an extension of the LFM Teacher's Guide directions, students can also render their shoe box measurements into a full color image map and 3-D surface plot, both closely resembling images generated by the actual MOLA instrument.
|
|
|
1. Record all altimeter rod readings on spreadsheet. Be sure numbers entered represent height of surface, not depth of rod. 2. Upon completion of measurements, highlight and save spreadsheet data as ASCII TEXT. 3. Open NIH Image or Scion Image, go to File menu and import spreadsheet data as TEXT. 4. Go to EDIT and select SCALE AND ROTATE. 5. Enter 25 as a new scale number 6. Click off NEAREST NEIGHBOR interpolation and click on BILINEAR. Click OK 7. Drag down OPTIONS and select COLOR TABLES. Select RAINBOW.
8. Go to Analyze on the menu bar and drag down to Surface Plot. 9. Click off WIREFRAME and click on GRAYSCALE/COLOR. 10. Click OK
11. Compare the images rendered from shoe box data to actual MOLA images found on the Mars Global Surveyor website. Return to MOLA at CMS
|
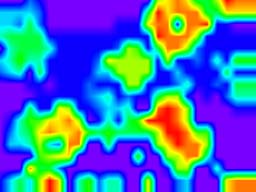 Sample Image Map
 Sample Surface Plot